In discussing principal coordinate analysis (PCoA), the question naturally arose of “how could we incorporate non-spatial data into this method?” Well, that is what I wanted to explore.
If we include an attribute e.g. crime rate, and embed that into the spatial components generated by PCoA we would truly be doing spatial dimension reduction. Not only would we be encoding spatial patterns, but we would be encoding spatial patterns as they relate to some attribute across the spatial surface.
This is already explored in the context of gene expression via {spatialPCA} (website here). This is somewhat different to what I explored in my previous blog post. My brief review of the paper and R package tells me that the spatialPCA method applies the spatial weights matrix into the covariance matrix used in PCA.
What I’m going to explore is a bit different than that.
Univariate spatial encoding
Naturally, we want to look at how we can incorporate attributes into PCoA. Lets first start by creating a spatial weights matrix.
As always, we use the Guerry dataset since it is tried and true. Here I create a spatial weights matrix using contiguity to identify neighborhoods and we use a guassian kernel (like spatial PCA). The Gaussian kernel makes it so that locations that are closer have more weight than those further away. Since we are using contiguity, the distance is estimated by using centroids.
geom<-guerry$geometrypnts<-st_centroid(geom)# neighbors via contiguitynb<-st_contiguity(geom)# gaussian kernel weights for neighborswt<-st_kernel_weights(nb, pnts, "gaussian")(listw<-nb2listw(nb, wt, style ="B"))
Characteristics of weights list object:
Neighbour list object:
Number of regions: 85
Number of nonzero links: 420
Percentage nonzero weights: 5.813149
Average number of links: 4.941176

Weights style: B
Weights constants summary:
   n   nn       S0       S1       S2
B 85 7225 698.7942 2378.909 24825.15
Revisiting the spatial lag
The spatial lag is arguably the most fundamental spatial statistic. It is, in essence, the weighted average of a variable across a neighborhood.
To calculate the spatial lag, referred often to as , we multiply our spatial weights matrix by our neighboring values. Let’s walk through how this works really quickly.
We have the index positions of our neighbors and the weights that are associated with each of them.
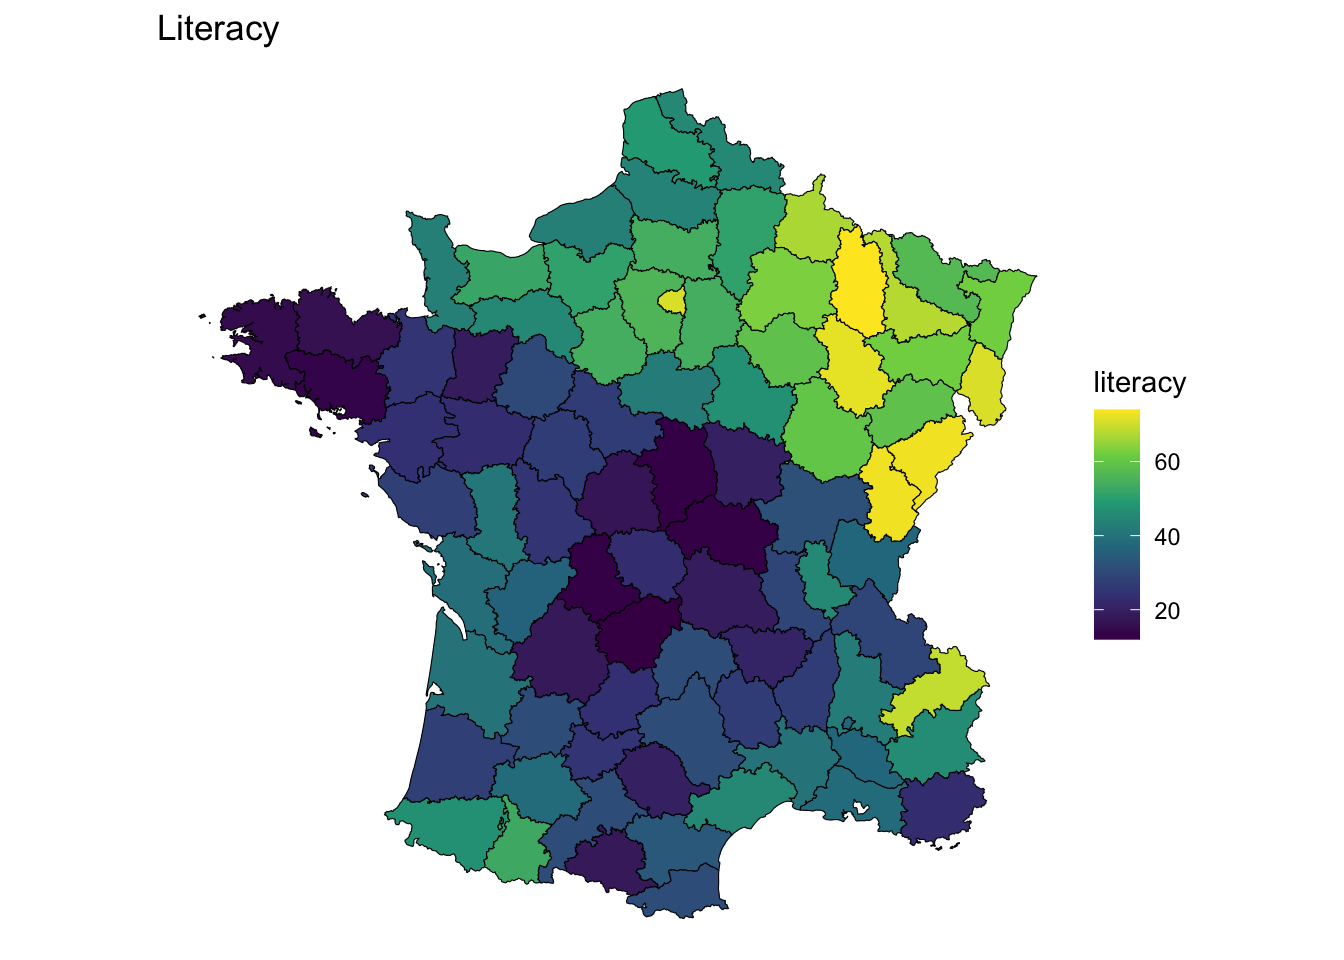
To calculate the spatial lag we first find the neighbors’ values for a vector x, multiply them by the weights and sum them up. In this case the variable is literacy.
We use the spatial lag to get a univariate estimate of the spatial neighborhoods value. We have a matrix of xj values that we multiply the spatial weights matrix and then perform a row summation.
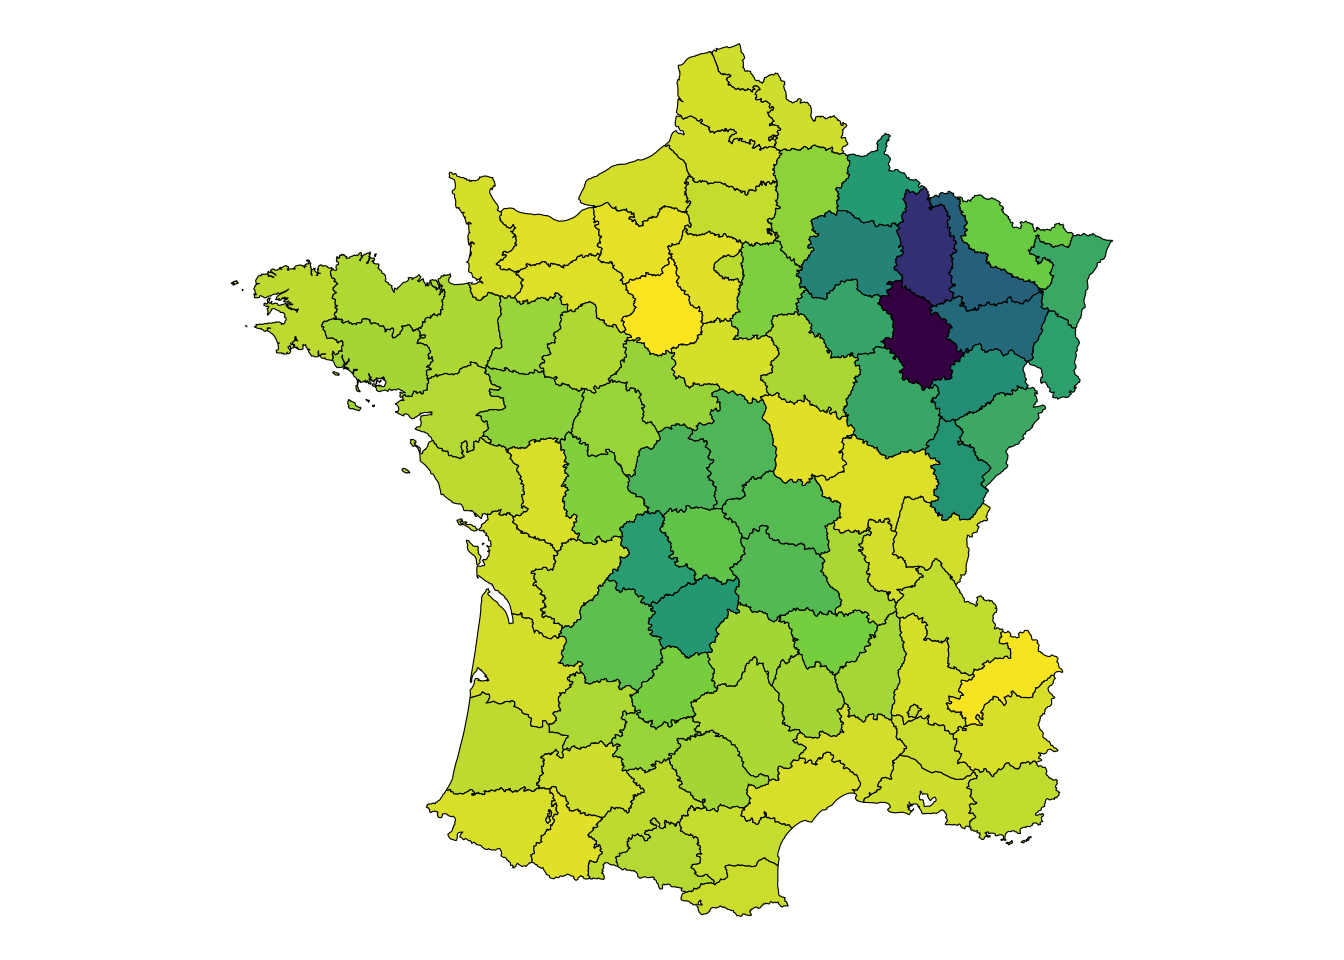
What if we didn’t perform that summation, and instead applied PCA onto the weighted values of xj?
We would then be encoding space and attributes into the components! In the below code chunk I am converting the spatial weights matrix to a sparse matrix and also creating a sparse matrix of the neighboring values. I am also scaling them.
How do we use this, though? That is the part I am not so clear on. We have multiple components and they all exhibit significant autocorrelation. The applicability of each of these components may depend a lot upon what they are used to predict. The interpretation of them is tougher than identifying the applicability.
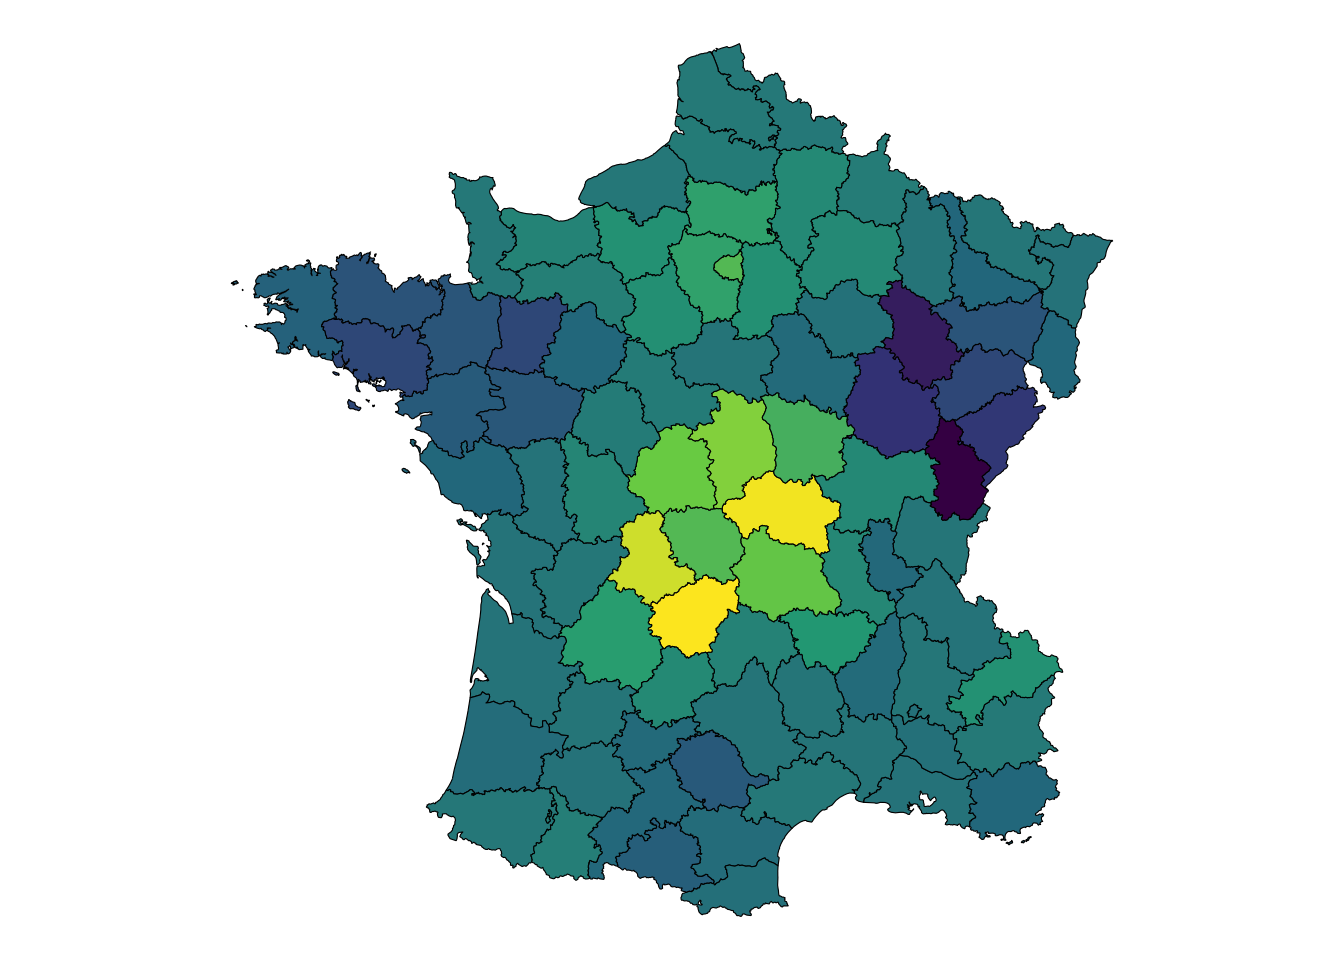
If we regress our components upon the variables in the Guerry dataset we might be able to see which patterns they can help explain away. This helper function filters out regressions with an of less than 0.1.
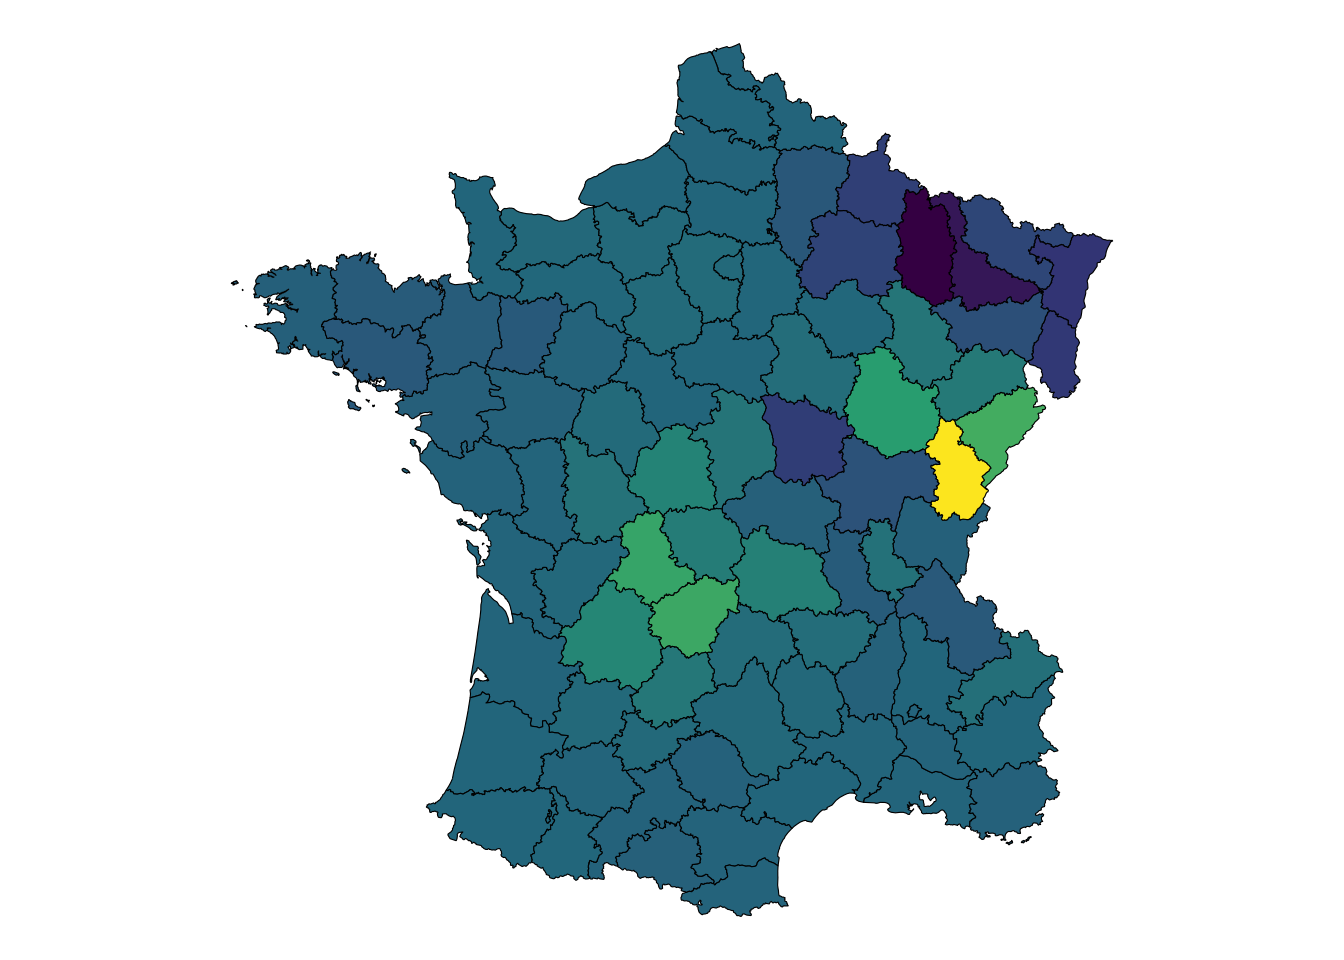
Interestingly the 3rd and 4th components are the most useful if we were looking for something to predict upon—this is a derived use case where we’re fishing for something that looks good.
Let’s explore this 4rd component a bit more. If we regress prostitutes ~ literacy we see that there is a much weaker model. Surprisingly, in fact. And the residuals are only very mildly autocorrelated. Why is the component such a strong predictor????
mod<-lm(prostitutes~literacy, data =guerry)summary(mod)
Call:
lm(formula = prostitutes ~ literacy, data = guerry)

Residuals:
   Min     1Q Median     3Q    Max
-415.6 -122.3  -40.5   57.9 4314.3

Coefficients:
            Estimate Std. Error t value Pr(>|t|)
(Intercept) -208.002    134.721  -1.544  0.12641
literacy       8.981      3.147   2.854  0.00545 **
---
Signif. codes:  0 '***' 0.001 '**' 0.01 '*' 0.05 '.' 0.1 ' ' 1

Residual standard error: 502.9 on 83 degrees of freedom
Multiple R-squared:  0.08935,   Adjusted R-squared:  0.07838
F-statistic: 8.144 on 1 and 83 DF,  p-value: 0.005455
    Moran I test under randomisation

data:  x
weights: listw

Moran I statistic standard deviate = 5.0023, p-value = 2.832e-07
alternative hypothesis: greater
sample estimates:
Moran I statistic       Expectation          Variance
      0.142390596      -0.011904762       0.000951401
Adding in the component to the model, the shoots right up! But why?
mod<-lm(prostitutes~literacy+comps$rotation[,4], data =guerry)summary(mod)
Call:
lm(formula = prostitutes ~ literacy + comps$rotation[, 4], data = guerry)

Residuals:
   Min     1Q Median     3Q    Max
-766.7 -103.4  -65.6   36.5 3210.5

Coefficients:
                    Estimate Std. Error t value Pr(>|t|)
(Intercept)         -165.523    113.683  -1.456    0.149
literacy               6.326      2.688   2.353    0.021 *
comps$rotation[, 4] 2604.594    440.074   5.919 7.25e-08 ***
---
Signif. codes:  0 '***' 0.001 '**' 0.01 '*' 0.05 '.' 0.1 ' ' 1

Residual standard error: 423.5 on 82 degrees of freedom
Multiple R-squared:  0.3619,    Adjusted R-squared:  0.3464
F-statistic: 23.26 on 2 and 82 DF,  p-value: 9.995e-09
    Moran I test under randomisation

data:  x
weights: listw

Moran I statistic standard deviate = 2.3311, p-value = 0.009874
alternative hypothesis: greater
sample estimates:
Moran I statistic       Expectation          Variance
      0.100827939      -0.011904762       0.002338715
Often when there is a spatial effect of a variable, we utilize its spatial lag in the model. This is an SLX model but simplified.
mod<-lm(prostitutes~literacy+st_lag(x, nb, wt), data =guerry)summary(mod)
Call:
lm(formula = prostitutes ~ literacy + st_lag(x, nb, wt), data = guerry)

Residuals:
   Min     1Q Median     3Q    Max
-500.7 -138.6  -29.5   54.1 4237.2

Coefficients:
                   Estimate Std. Error t value Pr(>|t|)
(Intercept)       -155.2878   149.8723  -1.036  0.30319
literacy            10.7142     3.8112   2.811  0.00617 **
st_lag(x, nb, wt)   -0.3858     0.4764  -0.810  0.42034
---
Signif. codes:  0 '***' 0.001 '**' 0.01 '*' 0.05 '.' 0.1 ' ' 1

Residual standard error: 503.9 on 82 degrees of freedom
Multiple R-squared:  0.09657,   Adjusted R-squared:  0.07454
F-statistic: 4.383 on 2 and 82 DF,  p-value: 0.01554
    Moran I test under randomisation

data:  x
weights: listw

Moran I statistic standard deviate = 5.2839, p-value = 6.322e-08
alternative hypothesis: greater
sample estimates:
Moran I statistic       Expectation          Variance
      0.167643014      -0.011904762       0.001154633
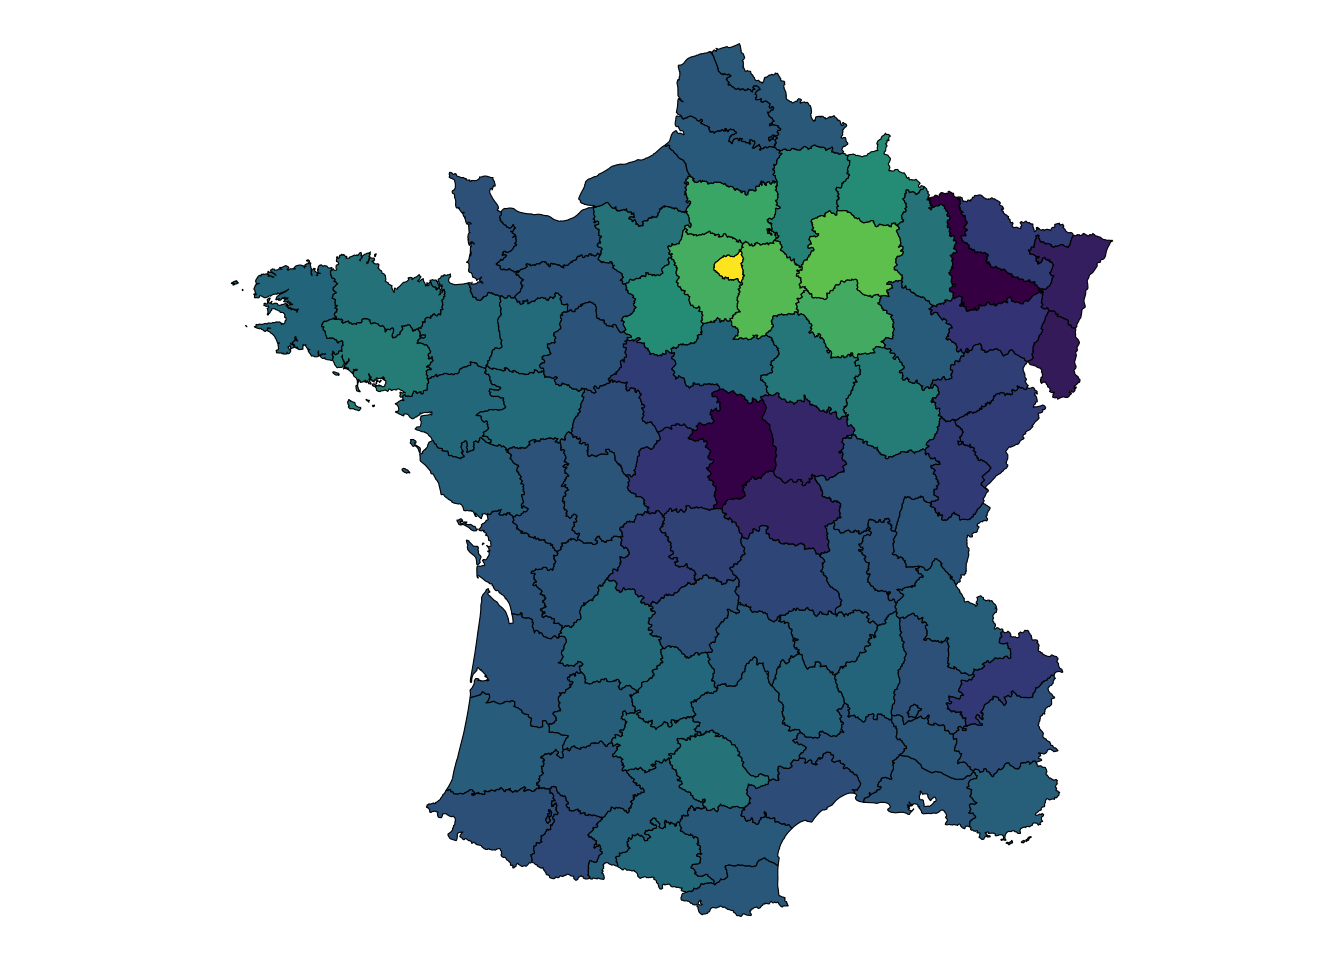
Is this all autocorrelation? What if we look at including just a spatial component? What is interesting is that if we recreate this process using only the Moran’s Eigenvectors, there is nothing meaningful to be extracted that predicts prostitution as well as the spatial univariate component!