JHU talk (slides)

objectives

  • tell you my story
  • maybe inspire you to program
  • a brief lesson on spatial analysis
  • anything you want this is your time

A bit about myself

or, why should you actually listen to me

It’s a me

  • MS in Urban Informatics, Northeastern
  • Sr. Product Engineer @ Esri
    • Spatial Statistics
  • Previously @ RStudio (now Posit)
  • Programming in R since 2014

humble beginnings

Plymouth State

PSU is nationally recognized

but not in the way that most people want to be

“…this New Hampshire institution of higher learning is back. Four things students dig are skiing, skiing, studying and [partying] on the lake.

Playboy, 2010

finding geography

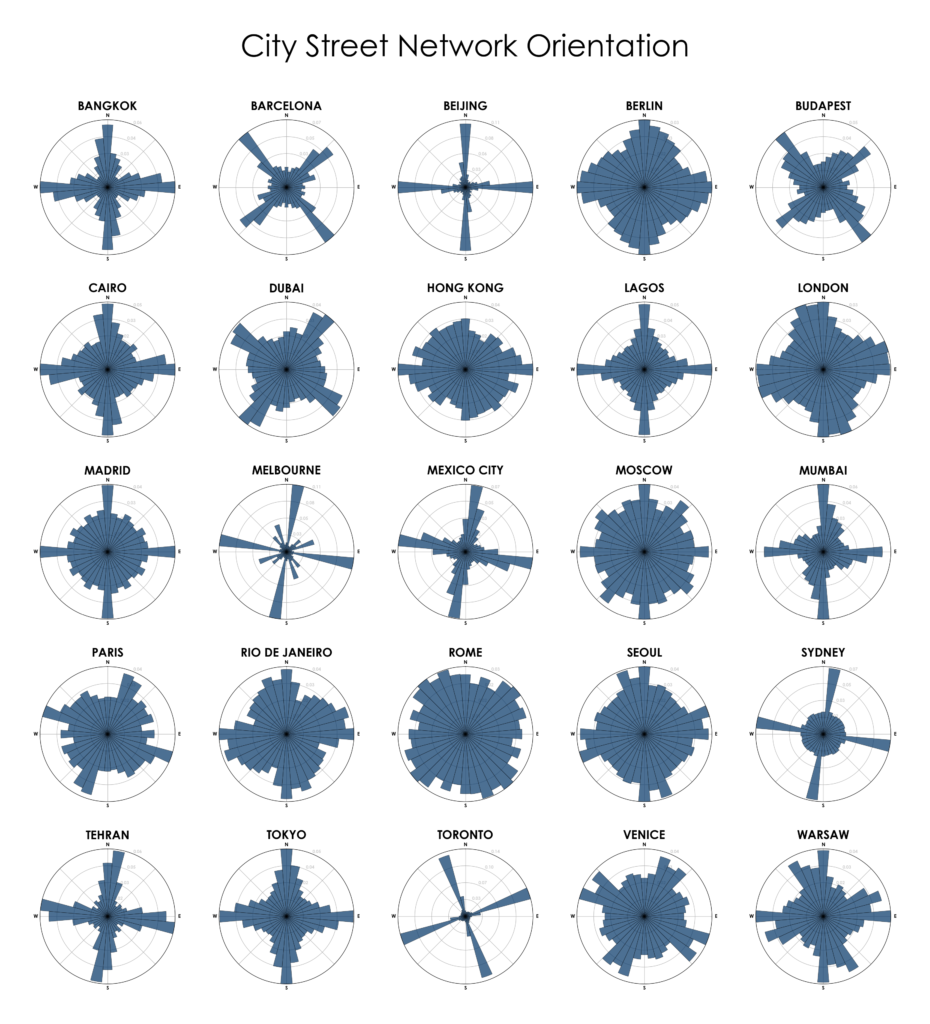
from anthropology & sociology to GIS

Tobler changed my perspective

“everything is related to everything else, but near things are more related than distant things.”

Waldo Tobler

Humanity is inherently spatial

everything we do happens somewhere

I become a GIS pro

stats interest became an R interest

  • wanted to do more advanced stats
  • learned 1:1 with my professor
  • finding data meant cleaning data
  • explored new packages and exposed to new domains
    • natural language
    • software engineering
    • etc

The next few years

  • spend all my free time learning R
  • I intern at DataCamp making R courses
  • Research using interactive GIS
  • Decide grad school was the right thing for me
    • promptly rejected from all but one school

Northeastern

Advanced Spatial Analysis

Advanced Spatial Analysis

  • one of my last courses in grad school
  • learned about spatial autocorrelation
  • spatial regression
  • basics of networks analysis

a pandemic rages

Going beyond maps

neighborhoods, autocorrelation, and tooling

Neighborhood

fundamental concept of analysis ## In urban studies

  • the neighborhood fundamental to sociology
    • Chicago school (Park & Burgess)
  • used to understand differences inside of the city
  • too much nuance

In spatial analysis

  • are phenomena spatially dependent?
    • do similar values occur near each other
  • start focal with a location \(i\)
  • it’s neighbors are \(j\)
  • \(X_i\) is compared to \(X_j\)
    • not to \(X\)

how do we define the neighbors?

it depends….

contiguities

how do you choose what the neighbors are for a location?

Rook Contiguity

Rook Contiguity

Queen contiguity

Queen contiguity

Neighbors in practice

Evaluating the neighborhood

how does \(i\) compare to \(j\)

the spatial lag

the neighborhood value

Understanding the lag

  • “expected value” of the neighborhood
  • it is the average value of the neighborhood (excluding \(i\))
  • summarizes values of \(x\) for an observation \(i\)’s neighborhood

Observed values

Neighborhood values at \(i\)

the lag is a neighborhood smoother

Observed vs neighborhood

where locations deviate from their neighbors

Spatial Lag is the basis of:

  • spatial clustering (autocorrelation)
  • hot spot detection (clustering)
  • spatial regression
    • (inference / neighborhood spill over effects)
  • spatio-temporal hot spot analysis

Example

Example

Tools in the R ecosystem

  • sf - spatial vector data
  • spdep - spatial statistics
  • sfdep - a tidy interface to spdep
  • rgeoda - R interface to GeoDa

Tools in Python ecosystem

  • geopandas - sf equivalent
  • pysal a very robust set of spatial statistics toools
  • shapely for geometries

What do you want to do next?

  • i can answer questions
  • i can demo code
  • i can talk through the spatial lag in more detail
  • we can discuss hot spot analysis
  • anything you want :)