| Region | Population |
|---|---|
| WY | 563626 |
| CA | 37253956 |
| US | 308745538 |
On October 6, 2018, the US Senate voted 50–48 in favor of the appointment of Associate Justice Brett Kavanaugh. This led many pundits to point out a “disconnect” between the Senate and the body politic. The 50 senators who voted “yea” represent only 44% of the nation’s population. The year prior, Supreme Court Justice Neil Gorsuch was confirmed by 54 senators representing approximately 45% of the population. This trend of increasing control by a decreasing portion of the constituency has been attributed to a rise in partisanship.
In the age of minority rule, a Supreme Court justice appointed by a president who got fewer votes is confirmed by a party in the Senate that got fewer votes, to validate policies opposed by most Americans: https://t.co/HoCoFnXnZV
— Paul Waldman (@paulwaldman1) July 10, 2018
good morning! just sitting here drinking coffee and thinking about how the state of wyoming has two senators and a total population smaller than portland, oregon. hbu?
— sarah jeong (@sarahjeong) February 21, 2019
Since the mid 90’s Dr. Frances E. Lee has been developing a body of literature on Senate apportionment, and her book Sizing Up the Senate has become part of the current political milieu (Vox, CNN, New York Times). The book discusses, among many things, the relevant historical context surrounding the creation and organization of the Senate at the constitutional Convention. In her 1998 paper “The Consequences of Senate Apportionment for the Geographic Distribution of Federal Funds” (Lee, 1998), Dr. Lee describes the “representation index”, a measure to quantify the over- or underrepresentation of a state in the US senate. In the formulation described in the paper, “the index is simply the ratio of the state’s actual population to 1/50th of the nation’s population” (Lee, 1998). In the formulation described in the paper, “the index is simply the ratio of the state’s actual population to 1/50th of the nation’s population” (Lee, 1998). It is written mathematically as
when the [index] is equal to one, the state is neither over- nor underrepresented by reference to a one person, one vote standard; when it is less than one, the state is overrepresented; when it is greater than one, the state is underrepresented. (Lee and Oppenheimer, 1999, p.161)
Many of Lee’s analyses utilize this index, and it has proved useful in temporal comparisons and modeling. However, it does not seem immediately capable of effectively evaluating other legislative bodies such as the House of Representatives. Here I will put forth an adaptation of this measure. That measure will then be adjusted to evaluate the House of Representatives. The House model will then be generalized to fit any representative body.
Interpretibility
The representation index has three main shortcomings, each of which are simple to address. First, the index produces a counter-intuitive number. An index of greater than 1 indicates an underrepresented state, and vice versa. Second, the interpretation of a middle value of 1 is useful for the “one person, one vote” standard. But the index is a divergent measure where 1 is the middle with the bounds (0,∞). Often, when one thinks of divergence, it is from an origin, or 0. Third, the index has a lower limit of 0 and no upper bound. This inhibits comparisons in both directions.
To illustrate the point let’s take the populations of California and Wyoming based on 2010 Census figures.
If we calculate the representation index for these places, we get:
| Region | Population | Representation Index |
|---|---|---|
| WY | 563626 | 0.09 |
| CA | 37253956 | 6.03 |
In this example, California has a representation index of 6. This means that it is vastly underrepresented, whereas Wyoming has an index value of nearly 0 meaning it is vastly overrepresented. To interpret this, we must remember that a larger value actually means less representation.
But if we invert our formula, we obtain a more informative number.
| Region | Population | New Rep. Index |
|---|---|---|
| WY | 563626 | 10.96 |
| CA | 37253956 | 0.17 |
In this table it is clear that Wyoming is overrepresented and California is underrepresented. But still, in evaluating these numbers we are required to do the mental math to contextualize the divergence from a middle value. California has a value of 0.83 less than the one person, one vote standard. To handle this, we can center the score around 0 by simply subtracting 1.
| Region | Population | Representation Index | New Rep. Index |
|---|---|---|---|
| WY | 563626 | 0.09 | 9.96 |
| CA | 37253956 | 6.03 | -0.83 |
Thus the formula for the new representation index is
The URI and ORI are informative, but both are biased in scale. The bounds of the URI are
The ORI can be altered slightly to create this balanced measure. By taking the natural logarithm of the ratio 1/50th of the US population to a state’s population, a divergent scale naturally occurs. When the ratio is equal to 1 (or adhering to the one person, one vote standard), the value becomes 0. When the denominator is less than the numerator (or when the state has a smaller share of population than its share of votes), the value is positive and vice versa. Thus we arrive at the formula
| Region | Population | URI | ORI | New Rep. Index |
|---|---|---|---|---|
| WY | 563626 | 0.09 | 9.96 | 2.39 |
| CA | 37253956 | 6.03 | -0.83 | -1.80 |
The new representation index can be generalized to the House of Representatives or any other representative body. In the following sections, the representation index is adapted to the House of Representatives, the California Assembly and Senate, and the New Hampshire House and Senate.
Representation Index and the House of Representatives
Representation in the House of Representative is proportional meaning that a state has a number of legislative representatives proportional to its population. For example, if a state were to have 50% of the nation’s population it should represent 50% of the legislative body. This is the principle that the representation index evaluates.
In the above adaptation of the representation index, the nation’s population is divided by 50. This would be the population of a single state if every state had the same number of citizens. Then, that number is scaled (divided) by the state’s actual population, and the logarithm of the result is the representation index. Thus if a state’s population is exactly equal to 1/50th of the nation’s population, its representation in the Senate is proportional.
To adapt this measure to the House, we must think about how the relationship between proportional representation and population can be expressed numerically. As mentioned above, proportional representation would mean that a state comprising 50% of the national population would likewise comprise 50% of the House’s representatives. The ratio of these two proportions is 1, which creates a similar comparison to Lee’s ratio of 1/50th of national population to state population. This is the motivation for a formula of a representation index for the House of Representatives. The new formula, then, is
In this case, if the share of the population is smaller than the share of representatives, the index is inflated, meaning the state is overrepresented. If the share of population is greater than the share of representatives, the index is deflated, meaning the state is underrepresented. This index ranges from
Generalizing the Representation Index
The representation index for the House of Representatives is written in such a way that it can be adapted for any representative body. The formula evaluates equality of the share of representatives and the share of the total constituency. In general, the formula can be written as
To illustrate, let’s use this formula to calculate the representation index of the Assembly and Senate of California. In 2011, after the most recent census, California redrew its districts. The data used in this demonstration are from the LA Times. The California Assembly and Senate have 80 and 40 members respectively each representing one district.
For this example, I consider a difference of 5% in either direction as adhering to the one person, one vote principle. To illustrate this, if the ratio is
The above example demonstrates the use of the representation index for both houses of the California legislature. This is good news as it demonstrates that the state upholds the Equal Protection Clause of the Fourteenth Amendment and adheres to the Supreme Court decision Reynolds v. Sims, in which the court held that state districts must be proportionally drawn (unlike US Senate districts).
As Wikipedia states, “[given California]’s large population and relatively small legislature, the Assembly has the largest population per representative ratio of any lower house legislature in the United States; only the federal U.S. House of Representatives has a larger ratio.” California’s representative body differs greatly from that of, for example, New Hampshire.
New Hampshire has arguably the most unique lower house legislature of any state: there are 400 representatives from 204 districts. House districts also include what are called floterial districts, areas that represent multiple municipalities. The legality of such districts has been disputed in the state Supreme Court, but nonetheless they persist, and as a result, New Hampshire has one of the smallest constituent-to-representative ratios in the nation. This results in overrepresentation for almost every municipality.
The above chart illustrates this phenomenon. Interestingly, the most populous cities and towns in the region are represented according to the one person, one vote paradigm. When applied to the state senate, the results are much different.
The representation index for the New Hampshire Senate trends toward underrepresentation. The median value is shown with a dotted red line. It is apparent that the representation of the Senate of New Hampshire is not as equally representative as that of California. The population distribution across the state is highly unequal with a vast majority residents living close to the Maine and Massachusetts borders plausibly contributing to this inequality.
Further Directions
The ability to compare representation across governing bodies has large implications for comparative political analysis. Further development of the representation index allows scholars and researchers to compare constituency representation among similar bodies—as demonstrated with the case of California and New Hampshire.
The new formulation of the representation index is conducive to inter-governmental body analysis. This is possible by the index’s ability to place bodies of different size on the same scale. A result of this is the ability to perform hypothesis testing among groups. As a motivating example, the representation indexes of states are compared along partisanship lines.
State Senate representation indexes were calculated using the general representation index formula for all 50 states. A two-sample t-test was performed comparing states with two Republican senators to those with two Democratic senators. In doing so, we fail to reject the null hypothesis
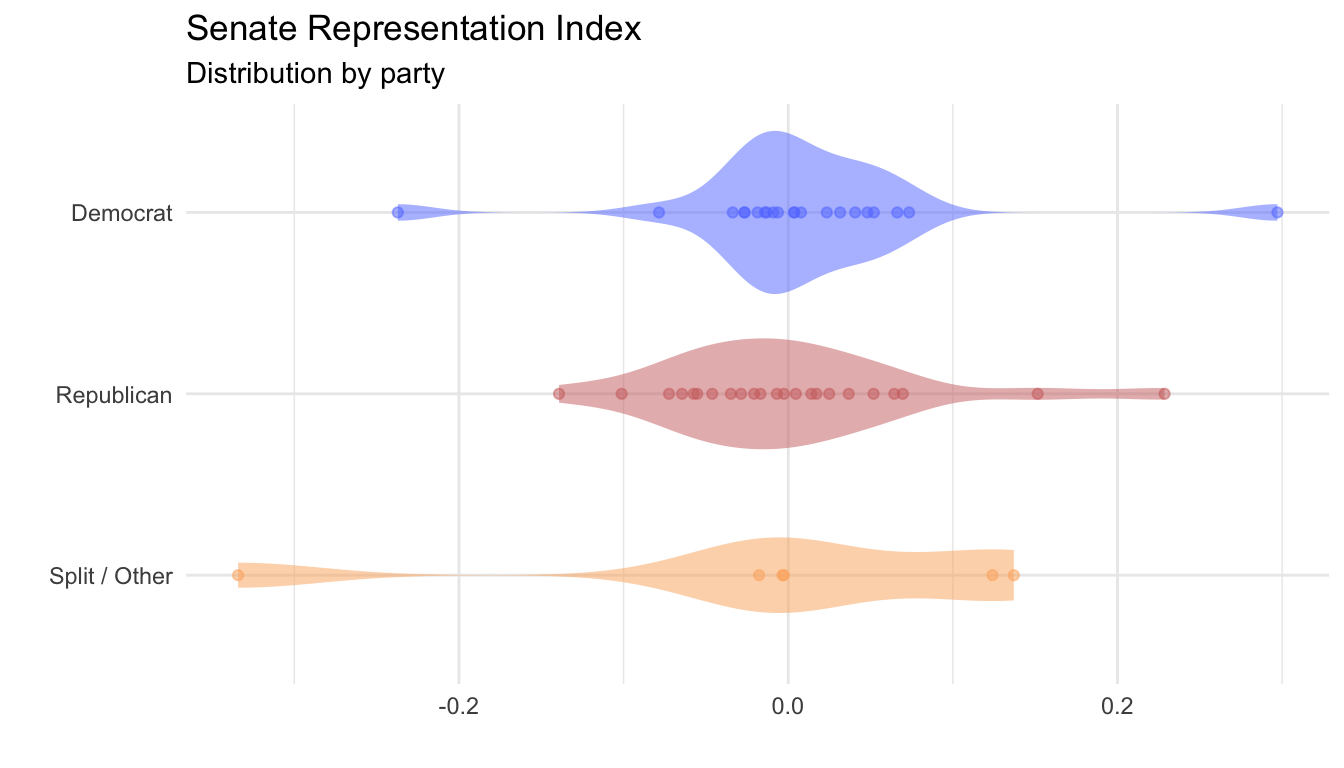
| Party | n | Mean | SD | SE |
|---|---|---|---|---|
| Democrat | 21 | 0.19 | 0.99 | 0.22 |
| Republican | 23 | 0.67 | 0.99 | 0.21 |
| Split / Other | 6 | 0.79 | 1.16 | 0.47 |
| Total | 50 | 0.48 | 1.02 | 0.14 |
It has been demonstrated that the representation index is an informative measure that can be utilized to examine over and underrepresentation of a governing body. This new formulation of the representation index is useful in its ability to evaluate both over and under-representation and to compare different political entities. One could imagine, for example, a comparison of constituency representation between the United States and France’s upper and lower legislative houses.